Table of Contents (ToC)
4. Sum, Range, Gap & Repeat filters
Under this number generator filtering section you rill find range sliders representing, min. and max. values, along with a text field located under each of those sliders. This is how this powerful set of filters was pre-set for the US Powerball, while using the number generator for this help page.
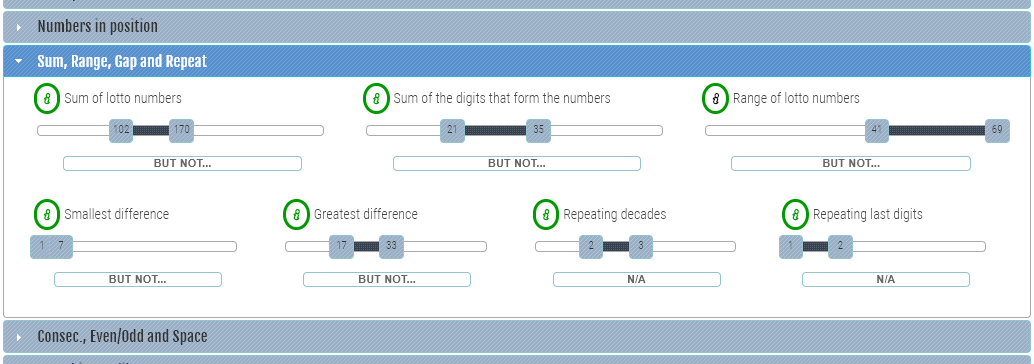
Each slider allows you to set the minimum and the maximum values while the text field under the slider gives you the possibility to eliminate certain values that fall between the range defined with the slider above. This way, a certain range of values can be set as mandatory and, at the same time, certain values can be excluded.
The lowest and highest value for each slider can be set to the lowest respectively highest possible value of that statistical factor. In our example, the lowest possible sum of a set of US Powerball results is 15. That would be the SUM of 1+2+3+4+5. And 65+66+67+68+69 = 335, is the highest possible sum for a US Powerball combination.
Tip: Fine-tune the values by clicking on a slider button and using the left, right arrow keys on your keyboard to move it.
Sum of lottery numbers
Probably the best way to explain the functionality of the SUM range slider and the text field underneath it is by providing an example.
Let's say you have set the Sum of lottery numbers slider to 102 and 170 (min. and max. values) as in the above screen-shot.
From the US Powerball results generated earlier, we can easily calculate the SUM of the numbers for the first two generated results. They are:
112 (=03+08+22+24+55) and 115 (=03+08+24+25+55)
We leave the SUM slider as it is (min. = 102, max. 170) and type "112,115" in the field right under the slider after which we click "Generate my numbers".
The result of this setting will force the number generator to return all possible US Powerball results having a SUM of numbers between 102 and 170 (included) but none of the results which have a SUM of numbers equal to 112 OR 115.
The text fields that have a placeholder reading "N/A" can not hold any value.
The same principle applies to the other six filters in this filtering section.
Sum of the digits
The SUM of the digits is slightly different than the SUM of the numbers. Instead of adding up the numbers from the lottery results, we add up the digits that make up the numbers.
Example: the sum of digits for numbers 03, 08 and 22 should be
(0+3) + (0+8) + (2+2) = 15.
So, by setting this filter slider to min. 21 and max 35, the number generator will return only the results that have the sum of their digitst >= 21 AND <= 35.
Range of lotto numbers
It is represented by the difference between the highest and the lowest numbers in a set of generated numbers. Example: the range of the generated US Powerball results 03, 08, 22, 24 and 55 is:
55 - 3 = 52.
If we were to move the right slider button under the "Range of lotto numbers" to the left until the value of that button would be 51, only one generated set of numbers (03-08-24-42-51 + 14) wold be be generated because it is the only one of the 9 that has a range within the newly set values of this filter.
1.4. Smallest difference
It our number generator, this will be smallest difference (or distance) between two adjacent numbers of a set of generated results.
Example: the smallest difference in the above example (1.3. Range) is 2. That would be the difference between numbers 24 and 22. The other differences are represented by a higher number. 5 is the difference between 8 and 3 (8-3=5), 14 is the difference between 22 and 8. And the last difference in our example is the...
1.5. Greatest difference
Represented by the greatest difference between two adjacent numbers of a set of lotto results. It is 19, the difference between 55 and 24.
Repeating decades
The number of same decades (the tens of a number) we want to have in the generated results
Here is another example: 7, 16, 21, 28, 38.
the decades have a repeat rate of 1 + 2. "How come?", you may ask.
Well, the decade of number 7 is 0 (zero), the decade of 16 is 1, the decade of 21 is 2, same as the decade of 28. And finally, the decade of 38 is 3. So, the first, second and fourth decades are only present once, so their repeat rate is 1. The third decade however has a repeat rate of two because it is present in two of the numbers, 21 and 28.
To make this as clear as possible, let's look at another example: Numbers 11, 12, 15, 17, 19 have a repeating decade reate of 5 because all numbers start with 1 which means the same decade appears five times. Based on the same logic, numbers 11, 12, 25, 27, 29 would have the decade repeat rate represented as 2 + 3.
Hopefully this makes sense so far...
Repeating last digits
This is very similar to the above except that, instead of counting the repeat rate of the first digit in each number, we count the last digit.
The following examples will reflect how the repeating last digits are being calculated.
Example 1: numbers 12, 22, 32, 35, 45 have 3 + 2 repeating last digits.
Example 2: numbers 7, 17, 23, 33, 45, 65 have 2 repeating last digits (each last digit appears twice).
Example 3: numbers 4, 5, 16, 28, 31 have a repeating last digit rate of 1 because all last digits exist once.
Example 4: numbers 8, 18, 28, 38, 48 have a repeating last digit rate of 5 due to the fact that the last digit "8" is found in all five numbers.
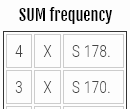
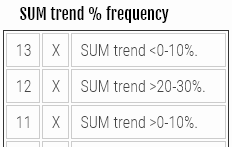
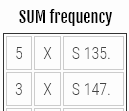
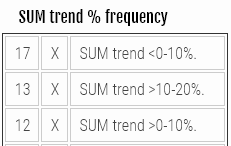
Let's take a look now at what data can be used to set this filter so that we catch the winning numbers. We will be looking at two SUM related factors the US Powerball and EuroMillions. The SUM frequency and the SUM trend (%) frequency. Both factors can be found in the lottery matrix
SUM and SUM trend frequency
The data shown above is based on the latest 100 US Powerball results and the latest 100 Euromillions results at 2019-05-04.
US Powerball SUM
US Powerball SUM trends
EuroMillions SUM
EuroMillions SUM trends
From the above screen-shots we can see that certain SUM of numbers do repeat. During the last 100 draws, the SUM of US Powerball numbers was 178 four times and 170 three times while the SUM of EuroMillions numbers was 135 five times and 147 three times.
And, the even more useful piece of information may be that 13 times the SUM of the Powerball numbers was up to 10% higher than the SUM of the previous results while 11 times was up to 10% lower. This means a deviation of +/- 20% in 24 draws out of 100.
Things look even better for Euromillions. The +/- 20% deviation occurred 29 times!
By looking at all this, we can conclude that, by using the right information from the previous lottery results with our number generator, anyone can significantly narrow down the next possible winning numbers.